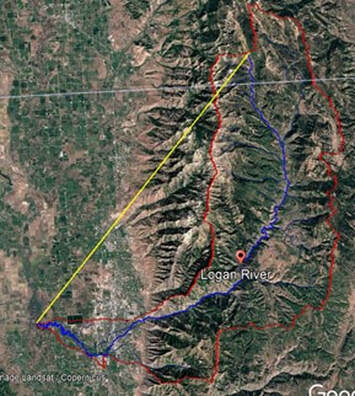
1 - Map of Logan River Watershed
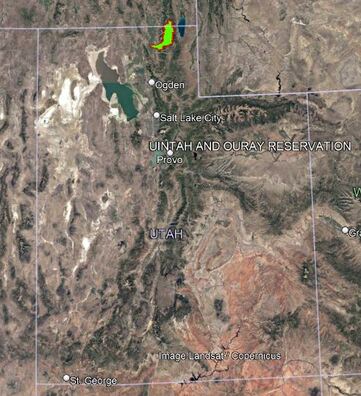
1. Make a Location Map.
- The map to the left shows the state of Utah with the Logan River catchment highlighted in green in the northeast corner of the state.
|
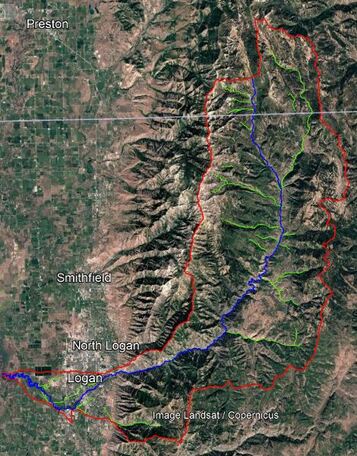
2. Make a map of the Logan River Watershed.
The map to the left shows the Logan River watershed. The watershed boundary is in red, the main stem of the Logan River is in blue and the perennial tributaries are in green. |
2 - Longitudinal Profile
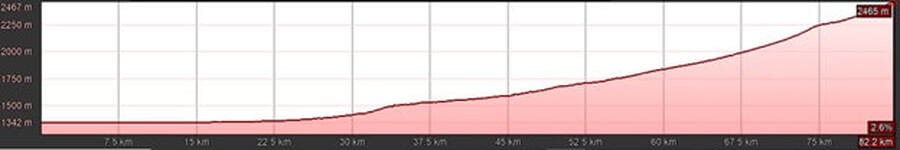
1. Produce a longitudinal profile graph.
2. What is the base-level control of Logan River today (the feature and its elevation)?
The base level elevation is 1344m. The base level control is the Logan River’s confluence with the Bear River.
3. What was the base-level control of the Logan River about 18,000 years ago (feature and elevation)?
The base level control about 18,000 years ago was Lake Bonneville. The lake surface elevation was about 1570m so the Logan River confluence was about 226m higher than it is today (USGS, 1962).
4. What is the mainstem length of the Logan River in kilometers?
The length of the main stem of the Logan River is 82.3km from Franklin Basin to the confluence with the Bear River. This is based on the main stem file mapped in Google Earth Pro.
5. What is the concavity (show calculation)?
Concavity is calculated by the following equation:
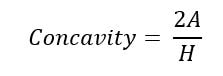
Where A(m) is the height difference between the profile at mid-distance and a straight line joining the end points of the profile and H(m) is the total fall of the longitudinal profile. The concavity of the Logan River mainstem is:
Elevation of straight line at midpoint (41,500 m upstream): 1344m + 2465m = 3809m / 2 = 1904.5m
Concavity = 2 * (1904.5m – 1565m) / (2465m – 1344m) = 0.61
Concavity = 0.61
6. Label any knickpoints (if present) and pose a working hypothesis about the controls?
Elevation of straight line at midpoint (41,500 m upstream): 1344m + 2465m = 3809m / 2 = 1904.5m
Concavity = 2 * (1904.5m – 1565m) / (2465m – 1344m) = 0.61
Concavity = 0.61
6. Label any knickpoints (if present) and pose a working hypothesis about the controls?
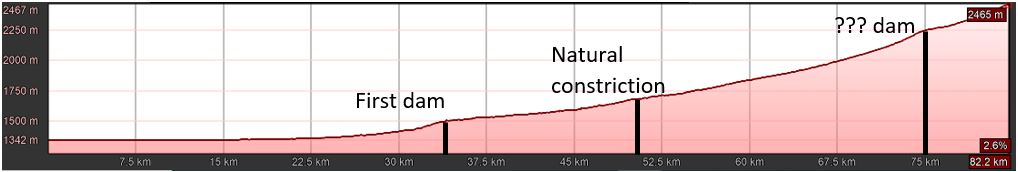
The river profile seems to show three knickpoints along the length. Each knickpoint is annotated on the graphic to denoted the possible controls. The lowest knickpoint (about 34km upstream of the confluence) is the location of First dam, which creates a reservoir behind it and lowers the slope upstream of the dam and increases it below the dam. The middle knickpoint is smaller and in an area without man made structures so the channel is probably controlled by bedrock or a pinch point. The upstream knickpoint is near the headwaters in Franklin Basin, so it is probably another natural constriction or a large beaver dam that is backing up flow.
3 - Catchment Morphometrics
1. What is its catchment length in meters?
The straight-line catchment length is approximately 43.47 km (43,470 m) according to the measure tool on Google Earth Pro.
2. What is its catchment area in square meters and in square kilometers?
The Logan River catchment area is approximately 646.56 sq km (646,560,000 sq m) according to Google Earth Pro.
3. What is the the catchment perimeter length in meters and kilometers?
The Logan River catchment perimeter length is approximately 172.4 km (172,404 m) according to the field calculator in QGIS.
4. Calculate the circularity ratio.
The circularity ratio is calculated using the following formula:
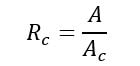
Where A (km2) is the catchment area and Ac (km2) is the area of a circle with the same circumference as the catchment. The circularity ratio for the Logan River catchment is:
Circumference of a circle = 2πr
172.4km = 2πr so r = 27.44km
Area of a circle = πr2
Ac = π*27.442 so Ac = 2365.18km2
Rc = 646.56km2 / 2365.18km2 = 0.27
Rc = 0.27
5. Calculate the elongation ratio.
The elongation ratio is calculated using the following formula:
Circumference of a circle = 2πr
172.4km = 2πr so r = 27.44km
Area of a circle = πr2
Ac = π*27.442 so Ac = 2365.18km2
Rc = 646.56km2 / 2365.18km2 = 0.27
Rc = 0.27
5. Calculate the elongation ratio.
The elongation ratio is calculated using the following formula:
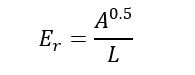
Where A (km2) is the catchment area and L (km) is the catchment length along its axis. The elongation ratio for the Logan River catchment is:
Er = (646.56 km2)0.5 / 43.47km = 0.58
Er = 0.58
6. Calculate the form factor of the Logan River Watershed.
The form factor is calculated using the following formula:
Er = (646.56 km2)0.5 / 43.47km = 0.58
Er = 0.58
6. Calculate the form factor of the Logan River Watershed.
The form factor is calculated using the following formula:
Where A (km2) is the catchment area and L (km) is the catchment length along its axis. The form factor for the Logan River catchment is:
Rf = 646.56 km2 / (43.47km)2 = 0.34
Rf = 0.34
7. What is the catchment relief of the Logan River Watershed?
The catchment relief is calculated using the following formula:
Rf = 646.56 km2 / (43.47km)2 = 0.34
Rf = 0.34
7. What is the catchment relief of the Logan River Watershed?
The catchment relief is calculated using the following formula:
Where Emax (m) is the highest peak in the catchment and Emin (m) is the elevation of the catchment mouth. The highest peak in the catchment is Logan Peak with an elevation of 3030m (bearriverinfo.org). The catchment relief for the Logan River catchment is:
H = 3030m - 1344m =
H = 1686m
8. What is the relief ratio of the Logan River Watershed?
The relief ratio is calculated using the following formula:
H = 3030m - 1344m =
H = 1686m
8. What is the relief ratio of the Logan River Watershed?
The relief ratio is calculated using the following formula:
Where H (m) is the maximum catchment relief and L (m) is the basin length along its axis. The relief ratio for the Logan River catchment is:
Rh = 1686m / 43,470m =
Rh = 0.039
9. What is the drainage density of the Logan River perennial drainage network?
The drainage density is calculated using the following formula:
Rh = 1686m / 43,470m =
Rh = 0.039
9. What is the drainage density of the Logan River perennial drainage network?
The drainage density is calculated using the following formula:
Where L (km) is the total length of stream channel and A (km2) is the catchment area. The total length of perennial stream channels in the drainage is 216.68km, according to the attribute tables in QGIS. The drainage density for the perennial streams of the Logan River catchment is:
Dd = 216.68 km / 646.56 km2
Dd = 0.34 km/km2
10. What is the drainage pattern of the Logan River drainage network?
The drainage pattern of the Logan River catchment is dendritic throughout the catchment.
Dd = 216.68 km / 646.56 km2
Dd = 0.34 km/km2
10. What is the drainage pattern of the Logan River drainage network?
The drainage pattern of the Logan River catchment is dendritic throughout the catchment.
4 - Stream Order
1. What is the stream order of the Logan River at its mouth?
Logan River at the mouth of Logan Canyon is 4th order stream when looking at its perennial streams.
2. What is the stream order of Temple Fork at its mouth?
Temple Fork is a 3rd order stream at its mouth.
3. What is the stream order of Beaver Creek?
Beaver Creek is a 1st order stream at its confluence with the Logan River.
4. Does the Logan River appear to obey the Hortonian laws of stream network composition?
Yes, the Logan River and its perennial streams appear to obey the Hortonian laws of stream network composition.
- Law of stream numbers – as the stream order increases, the number of streams of that order decreases. True.
- Law of stream lengths – as the stream order increases, the length of the stream of that order increases. True.
- Law of catchment area – as the stream order increases, the catchment area increases. True.
