In this assignment the RAVE plug in was used to view GUT (geomorphic unit tool) projects in the Asotin River in southwest Washington. Data from 2011 to 2017 was provided for two reaches along the Asotin to compare and provide analysis, with one reach being more straight and planar and the other having more sinuosity.
1. North Fork Asotin Creek
The north fork of Asotin Creek is a tributary to the Snake River in southwest Washington. There are two sites along the creek that have been heavily monitored and are included in this assignment. Each is about 250m long and are about 3.5km apart from each other. Both are in partially confined valley settings with riparian cover along the banks and scrub or grasslands farther up the slopes. The following map shows the location of the creek as well as the two study sites being analyzed. The yellow box is the F4 site and the blue box is the F6 site.
2. North Fork Asotin F4
2.1 Qualitatively describe the in-channel geomorphology of this reach.
The F4 site is fairly straight with minor bends along its' length. The water depth is fairly consistent without major changes in bed slope. There are a few pools and a few bars but none that dominate the entire wetted width. Most of the study area looks like a run.
2.2 Choose at least two survey years at this site to consider the temporal variability of morphology at this site. Which survey years are they and why did you choose them?
I chose survey years 2011 and 2014 to consider temporal variability at this sites. These were chosen because of the contrast in Tier 2 geomorphic units in each. The 2011 survey was mostly planar features while the 2014 survey included many bowl and trough shaped features. This shows that from year to year the channel bed is changing significantly or the surveys were taken during different flow regimes to create such different profiles.
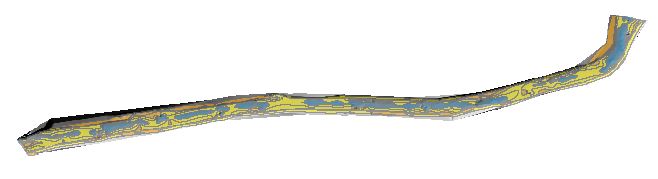
Figure 1. 2011 Tier 2
|
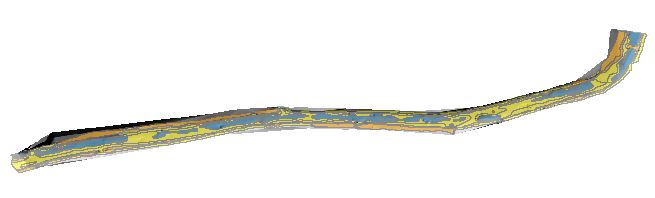
Figure 2. 2014 Tier 2
|
2.3 What Tier 2 Forms are present in each year? Do they differ?
The Tier 2 forms differ significantly, as can be seen in Figures 1 and 2 above. The 2011 survey (Figure 1) is mostly categorized as planar with a few concavities in the channel and a few convex features along the banks. The 2014 survey (Figure 2) shows mostly concave features with convex features along the banks. There are almost no planar features in 2014 at this site.
2.4 Do any of the Tier 2 Forms dominate the assemblage or is it fairly mixed? Is this true through time?
When looking at the entire series of GUT analyses for this reach, the forms change overtime. In 2011 (Figure 3 below), the features are mostly planar. In 2012 there is a shift towards more concave features, but there is still a mix of features throughout the reach. The forms stay mixed for the remaining survey years, as can be seen in the 2016 survey below (Figure 4). There is never a dominating assemblage of convex features in any year.
Figure 3. 2011 Tier 2 forms
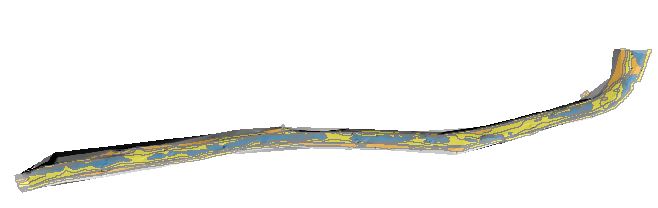
Figure 4. 2016 Tier 2 forms
2.5 What Tier 3 Geomorphic Units are present in each year?
This reach is dominated by glide-runs in ever year surveyed. There are some rapids in 2011 and 2012 (See Figure 5) but all the remaining years area almost entirely run dominated. Figure 6 shows the Tier 3 output for 2015 that shows glide-runs comprising almost the entire channel with some pools and bars throughout.
This reach is dominated by glide-runs in ever year surveyed. There are some rapids in 2011 and 2012 (See Figure 5) but all the remaining years area almost entirely run dominated. Figure 6 shows the Tier 3 output for 2015 that shows glide-runs comprising almost the entire channel with some pools and bars throughout.
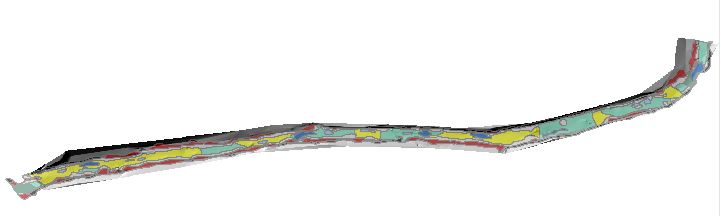
Figure 5. 2012 Tier 3 units
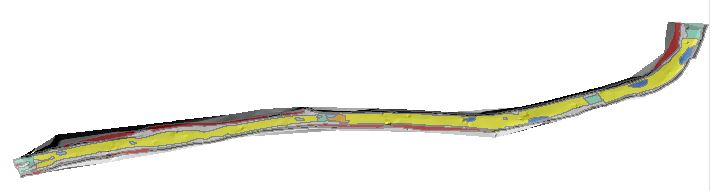
Figure 6. 2015 Tier 3 units
2.6 Zoom in to 2 to 5 x bankfull width portion of the reach and look at the arrangement of geomorphic units. Is it coherent? Does it make sense based on what you have learned so far?
Figure 7 below is the section I zoomed into, which is part of the 2012 survey. There are geomorphic units of pools, ponds, bank attached bars, runs and rapids present. These features make sense for the straighter alignment of the channel where there are faster and slower areas of the river based on slope but not based on the sinuosity of the channel.
Figure 7 below is the section I zoomed into, which is part of the 2012 survey. There are geomorphic units of pools, ponds, bank attached bars, runs and rapids present. These features make sense for the straighter alignment of the channel where there are faster and slower areas of the river based on slope but not based on the sinuosity of the channel.
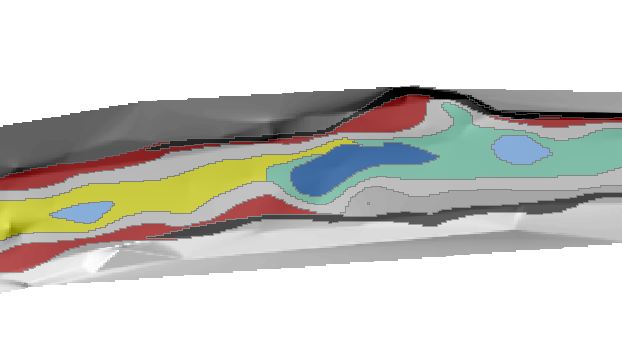
Figure 7. 2012 Tier 3 zoom in
2.7 How well does GUT appear to be doing in each year at discriminating the in channel geomorphic units? Point out any weaknesses or concerns you might have.
I think overall GUT does a very good job at identifying units in this reach of river, mostly because it is a fairly simple stretch. There are a few places where GUT identifies very small pools that seem too small to be accurately depicted by the software.
2.8 Identify in one of your surveys for this reach a distinctive pool, bar and planar feature. For all three identify all five attributes from the fluvial taxonomy (i.e., Table 6), then use those to identify the tier 3 name from Table 7 or 8 (this may differ than what GUT output is because it is not as resolved) and explain which attribute(s) were key for discriminating that unit from other units.
The following videos explain the features and how I identified them. I used the 2011 survey for these videos.
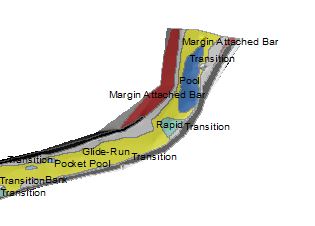
Figure 8. 2011 Tier 3 pool identification
2.8A : Pool
- 2.8 A1: GU Forcing - This pool is on the outside bend of a meander in the creek so there is some planform forcing.
- 2.8 A2: GU Orientation - This pool is running in the streamwise direction.
- 2.8 A3: GU Position - This pool is mid channel, but close to the outer bank.
- 2.8 A4: GU Low Flow WS Slope - Flat to shallow
- 2.8 A5: GU Low Flow Relative Roughness - Low
- 2.8 A6: Tier 3 Name - I think this is a bar forced pool.
- 2.8 A7: Which attributes key for discriminating? - The pool is on the outside bend of a meander and there is a bar forming on the inside bend forcing the thalwag to the outside and creating a pool
- 2.8 A8: Differences with GUT - Gut just names it a pool, so similar in naming.
Figure 9. 2011 Tier 3 bar identification
3.8B : Bar
- 3.8 B1: GU Forcing - This bar is on the inside of a bend so it is planform forced.
- 3.8 B2: GU Orientation - Streamwise
- 3.8 B3: GU Position - Bank Attached
- 3.8 B4: GU Low Flow WS Slope - Hard to say, on the lower side though
- 3.8 B5: GU Low Flow Relative Roughness - Low
- 3.8 B6: Tier 3 Name - This is a Point bar or bank attached bar
- 3.8 B7: Which attributes key for discriminating? GU forcing and position
- 3.8 B8: Differences with GUT GUT calls this a margin attached bar so similar.
Figure 10. 2011 Tier 3 planar identification
3.8C : Planar
- 3.8 C1: GU Forcing - None I can identify
- 3.8 C2: GU Orientation - Streamwise
- 3.8 C3: GU Position - Mid-Channel and channel spanning
- 3.8 C4: GU Low Flow WS Slope - Low
- 3.8 C5: GU Low Flow Relative Roughness - Low
- 3.8 C6: Tier 3 Name - Glide
- 3.8 C7: Which attributes key for discriminating? - The slope and relative roughness
- 3.8 C8: Differences with GUT - GUT calls this a glide-run, so similar.
- 2.9A - What is the tier 2 Form and the tier 3 shape of the unit you manually identified?
- 2.9B - How do the boundaries of the unit you mapped compare with what GUT derived?
- 2.9C - How does the type you identified compare with what GUT identified? Explain the discrepancies if they exist.
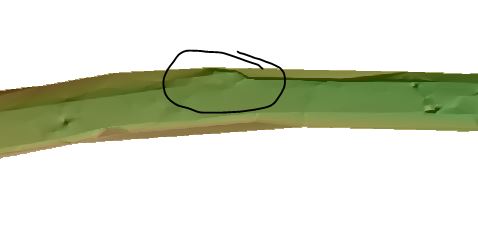
Figure 11. 2011 Tier 3 unit identification guess
|
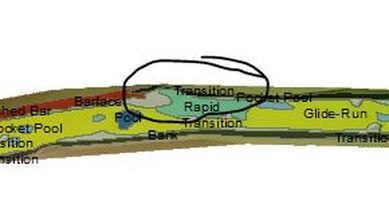
Figure 12. 2011 Tier 3 unit identification from GUT
|
This section of the river looks to have a large change in elevation, or an increase in slope over a short downstream length. It is bank attached and streamwise. The roughness is all similar. I think this is a run or rapid. When comparing to GUT, there is a rapid in this area but it is shown farther upstream with a transition area in the are that I identified as a rapid.
3 North Fork Asotin F6
3.1 Qualitatively describe the in-channel geomorphology of this reach.
This reach is much more sinuous than the other reach and looks to have some build up on bars and pools around the bends. The upstream and downstream ends of the reach seem to be straighter and much simpler in their geomorphology than the center section with the bends in it.
3.2 Choose at least two survey years at this site to consider the temporal variability of morphology at this site. Which survey years are they and why did you choose them?
I chose survey years 2011 and 2017 to look at the temporal variability of this site. I looked at the tier 1 forms to judge the variability. In 2011 (Figure 13 below), the channel was fairly simple with bends but no islands or large bars dirupting flow. In 2017 (Figure 14 below), this changed to show large bars around the bends and a wider channel overall. The immediate floodplain seems to have widened between 2011 and 2017.

Figure 13. 2011 Tier 1 forms
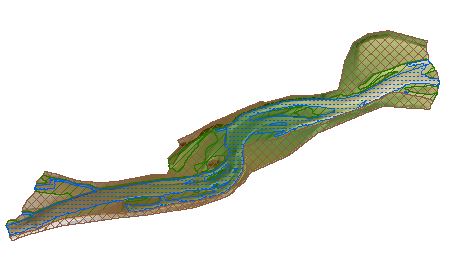
Figure 14. 2017 Tier 1 forms
3.3 What Tier 2 Forms are present in each year? Do they differ?
There are very similar Tier 2 forms for all the years in this reach. There is a blend of planar, concave and convex features, as would be expected with a more sinuous stretch of river. Below is an example of the Tier 2 forms (Figure 15).
There are very similar Tier 2 forms for all the years in this reach. There is a blend of planar, concave and convex features, as would be expected with a more sinuous stretch of river. Below is an example of the Tier 2 forms (Figure 15).
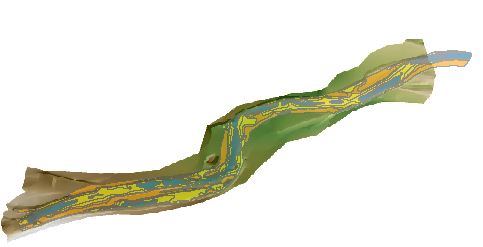
Figure 15. 2011 Tier 2 forms
3.4 Do any of the Tier 2 Forms dominate the assemblage or is it fairly mixed? Is this true through time?
As stated above and seen in Figure 15 above, the forms are fairly mixed but predictably varied around the bends with concave features around the insides of bends (bars) and convex around the outside of bends.
3.5 What Tier 3 Geomorphic Units are present in each year?
In 2011, the reach is mostly a run, with some margin attached bars throughout. There are a few pools but at this point the reach is fairly simple in terms of geomorphic units (see Figure 16). This begins to change in 2012 but larger changes are more obvious in 2013 (Figure 17). The upstream end of the channel shows some riffles and larger pools, while the central section of the channel has another riffle section that leads to a more divided run in the downstream section of the river. By 2017 the channel has become much more heterogeneous with lots of bars, a few pools and some riffles (Figure 18). The creek has also widened and has started creating additionally side channel, or cut offs.
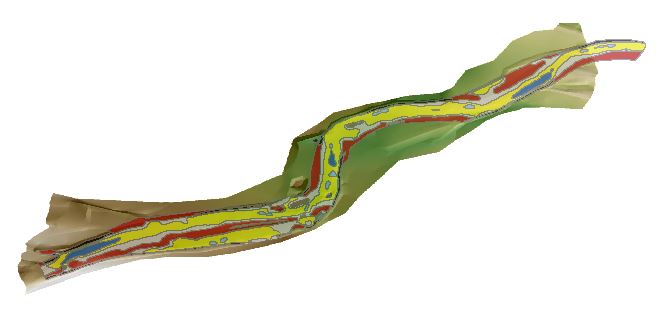
Figure 16. 2011 Tier 3 units
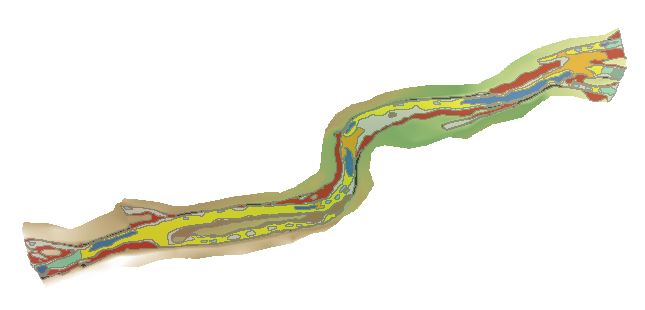
Figure 17. 2013 Tier 3 units
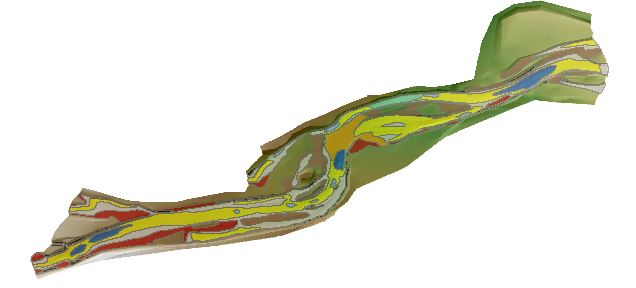
Figure 18. 2017 Tier 3 units
3.6 Zoom in to 2 to 5 x bankfull width portion of the reach and look at the arrangement of geomorphic units. Is it coherent? Does it make sense based on what you have learned so far?
Figure 19 below shows a zoomed in section of the reach in 2013. This reach is comprised of a run and transition zone at the upstream end, a riffle crest in the center and a pool and run towards the bottom. There is the start of a bank attached bar on the river right and the end of another bank attached bar on river left. This all makes sense because this screenshot was taken at the transition between bends in the reach and is showing a riffle and pool structure. The riffle crest between the run and the pool is saddle shaped, as expected and bars are forming on the inside bends of the meanders.
Figure 19 below shows a zoomed in section of the reach in 2013. This reach is comprised of a run and transition zone at the upstream end, a riffle crest in the center and a pool and run towards the bottom. There is the start of a bank attached bar on the river right and the end of another bank attached bar on river left. This all makes sense because this screenshot was taken at the transition between bends in the reach and is showing a riffle and pool structure. The riffle crest between the run and the pool is saddle shaped, as expected and bars are forming on the inside bends of the meanders.
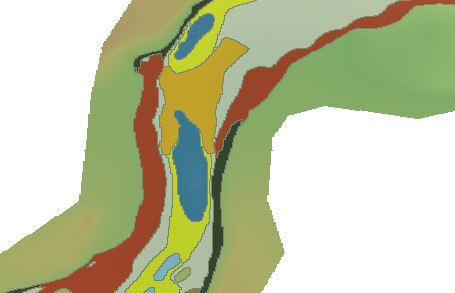
Figure 19. 2013 Tier 3 units zoom in
3.7 How well does GUT appear to be doing in each year at discriminating the in channel geomorphic units? Point out any weaknesses or concerns you might have.
Again, I think GUT is picking up on most of the geomorphic units in this reach, same as the last one. As the reach gets more complicated there are more transition zones, but that seems to be true in the field as well.
3.8 Identify in one of your surveys for this reach a distinctive pool, bar and planar feature. For all three identify all five attributes from the fluvial taxonomy (i.e. Table 6), then use those to identify the tier 3 name from Table 7 or 8 (this may differ than what GUT output is because it is not as resolved) and explain which attribute(s) were key for discriminating that unit from other units.
The following screenshots explain the features and how I identified them. I used the 2013 survey for these figures.
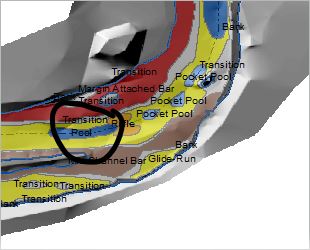
Figure 20. 2013 Tier 3 pool identification
3.8A : Pool
- 3.8 A1: GU Forcing - This pool is just downstream from a riffle so the upstream geomorphic unit is doing some forcing.
- 3.8 A2: GU Orientation - This pool is running in the streamwise direction.
- 3.8 A3: GU Position - This pool is mid channel, with areas of runs on either side.
- 3.8 A4: GU Low Flow WS Slope - Flat to shallow
- 3.8 A5: GU Low Flow Relative Roughness - Low
- 3.8 A6: Tier 3 Name - I think this is a structurally forced pool.
- 3.8 A7: Which attributes key for discriminating? - The pool is just downsream of a structural element and it is streamwise and mid-channel.
- 3.8 A8: Differences with GUT - Gut just names it a pool, so similar in naming.
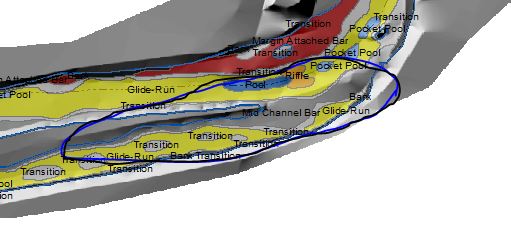
Figure 21. 2013 Tier 3 bar identification
3.8B : Bar
- 3.8 B1: GU Forcing - Island upstream that could cause some forcing
- 3.8 B2: GU Orientation - Streamwise
- 3.8 B3: GU Position - Bank Attached
- 3.8 B4: GU Low Flow WS Slope - Hard to say, on the lower side though
- 3.8 B5: GU Low Flow Relative Roughness - Varies
- 3.8 B6: Tier 3 Name - Compound bar with a boulder bar toward the island and possible eddy bar downstream.
- 3.8 B7: Which attributes key for discriminating? GU forcing and position
- 3.8 B8: Differences with GUT GUT calls this a mid channel bar but only seems true at higher flows, looks liek the bar attaches to the bank at lower flows.
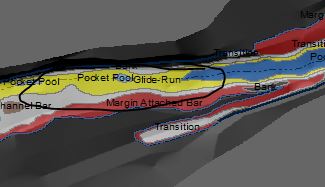
Figure 22. 2013 Tier 3 planar identification
3.8C : Planar
- 3.8 C1: GU Forcing - None I can identify
- 3.8 C2: GU Orientation - Streamwise
- 3.8 C3: GU Position - Mid-Channel
- 3.8 C4: GU Low Flow WS Slope - Low
- 3.8 C5: GU Low Flow Relative Roughness - Low
- 3.8 C6: Tier 3 Name - Glide
- 3.8 C7: Which attributes key for discriminating? - The slope and relative roughness
- 3.8 C8: Differences with GUT - GUT calls this a glide-run, so similar.
3.8. Turn off GUT and look just at the Topo DEM (e.g Detrended DEM and Contours) for one of the surveys. Manually map one geomorphic unit you think you can read in the topography.
- 3.8A - What is the tier 2 Form and the tier 3 shape of the unit you manually identified?
- 3.8B - How do the boundaries of the unit you mapped compare with what GUT derived?
- 3.8C - How does the type you identified compare with what GUT identified? Explain the discrepancies if they exist.
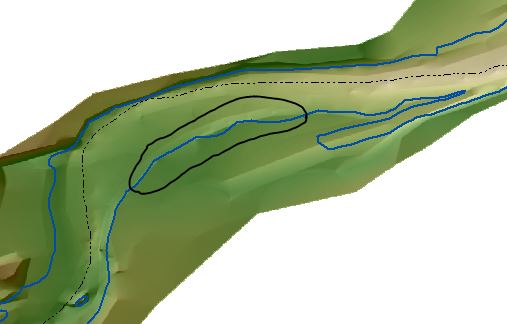
Figure 23. 2013 Tier 3 unit guess
|
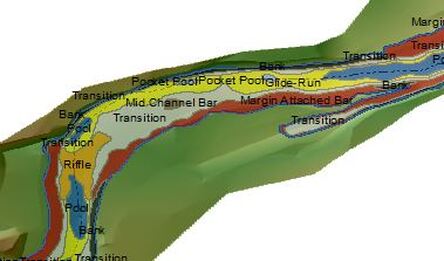
Figure 24. 2013 Tier 3 unit identification by GUT
|
In the screenshot above, from the 2013 survey, I am identifying a convex form that I would identify as streamwise in orientation, bank-attached position and planform forced. I am thinking this is a point bar or bank-attached bar along this inside bend. GUT calls this a margin attached bar and has it extending much farther downstream than I had outlined.
4. Differences between F4 and F6
4.1 What are the primary differences from exploring GUT between these two sites that you noticed between the in channel geomorphic units of these two sites?
The main difference between the two was the sinuosity. The F4 site was fairly straight which led to a run dominated channel without much interesting going on. The F6 site had a few meanders that created riffles and pools, as well as runs. This led to more diverse geomorphic units and more movement of sediment within the channel (bar development and meander).
4.2 What inferences can you make about geomorphic processes and behavior when contrasting GUT outputs between these two sites?
By looking at these surveys, I could see how a straighter channel has a hard time adding diverse characteristics to it compared to a meandering channel. The F4 site did not seem to show much lateral change in the survey period, while the F6 site seems to migrate and create more bars and tighter bends throughout the 7 year period.
4.3 If you only had one GUT output from each of these two sites (i.e. one snap shot) how representative would be your inferences about geomorphic processes? If you did not have the luxury of six or seven surveys, but just one, would your conclusions above be different?
While there might be less inference about development of the reach if you were only looking at one snapshot instead of a whole series of surveys, the inferences would still be the same. The F4 reach was fairly straight and run dominated in every year while the F6 segment shows more meander and more pools and bars than the F4 segment.
4. Synthesis
4.1 How are the Tier 2 Forms from GUT different than what we discussed in field?
The Tier 2 forms aren't different, they are just portrayed on a much finer scale than what we could assess in the field. If we tried to be as precise as GUT when we were in the field, we could be in one section for the river for a long time.
4.2 How are the Tier 3 GUs GUT exports different then the ones we discussed? Why do you think GUT does not output the same things?
We discussed way more different options for each form of Tier 3 options. There is some discretion in selecting these in the field and they do not have strong boundaries that can be easily applied in GUT, so GUT has to be more general.
4.3 How would you apply Tier 4? Do you have enough information here to do that?
Tier 4 is related to vegetation and grain size. These could be classified for some areas but the grain size distributions are pretty general and vegetation looks like it would have to be guessed based on the aerial imagery.
4.4 Does exploring these GUT outputs give you more or less confidence in applying the fluvial taxonomy through manual mapping off of topography versus identification in the field?
I could see how GUT is a useful tool for general mapping but it is not nearly as specific as you can be in the field for identifying different options for each form. It is great to the Tier 2 forms but photos videos or field visits would be better for identifying Tier 3 units.
